
NPCREP Bering Sea Ice Model Results
 The modeling component of NPCREP presently employs a 10-km resolution model
which spans the entire Bering Sea, based on the Regional Ocean Modeling System
(ROMS, Haidvogel et al 2000, Schepetkin and McWilliams 2005). ROMS is a primitive
equation, free-surface model constructed with curvilinear-orthogonal horizontal
coordinates and stretched vertical coordinates (further details available at
the ROMS
website). The stretched vertical coordinate system (here, 30 levels) is utilized
for enhanced resolution of both surface and bottom boundary layers. The full
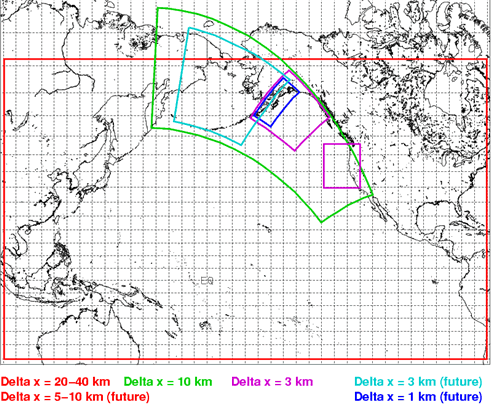
domain of the model includes the Northeast Pacific (NEP) from Baja California
through the Bering Strait, and extends from the coast to ~2000 km offshore.
This domain is nested within a larger one, spanning the entire North Pacific
at ~40-km resolution. This version of ROMS has been expanded to include ice
dynamics as implemented by P. Budgell (pers. comm.). Our hindcasts are driven
by NCEP winds and heat fluxes, with corrections to the NCEP shortwave flux based
on meteorological mooring data from the Bering Sea (Ladd and Bond, 2002). In
collaboration with E. Curchitser, we have developed model hindcasts for the
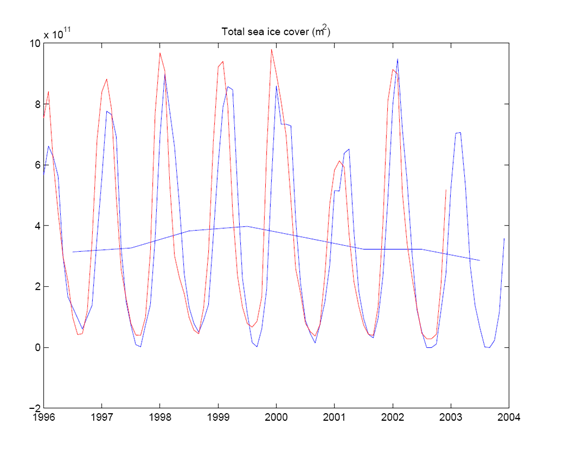
period 1996-2003 which do an excellent job of capturing the observed interannual
variability of ice cover in the Bering Sea (see Figs 1 and 2). More recently
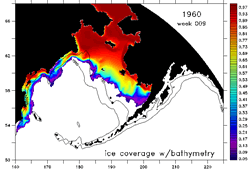
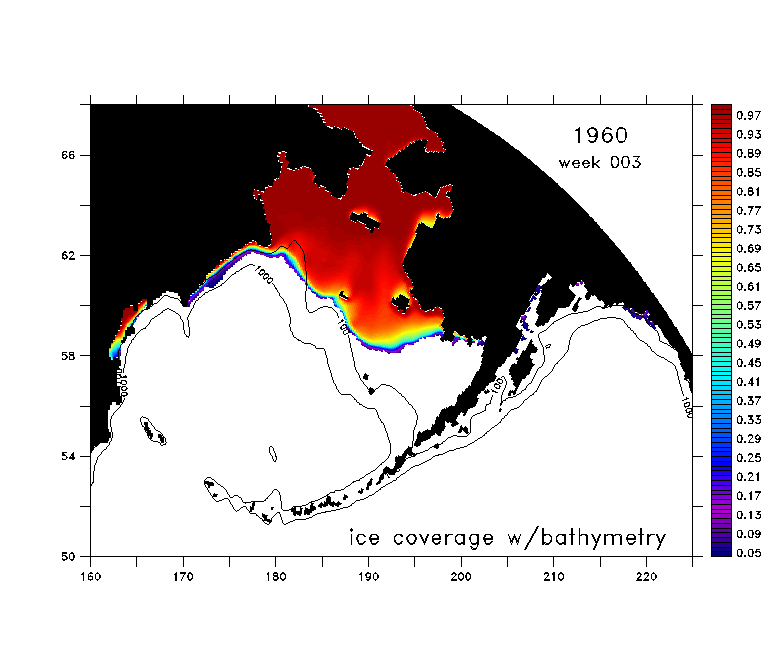
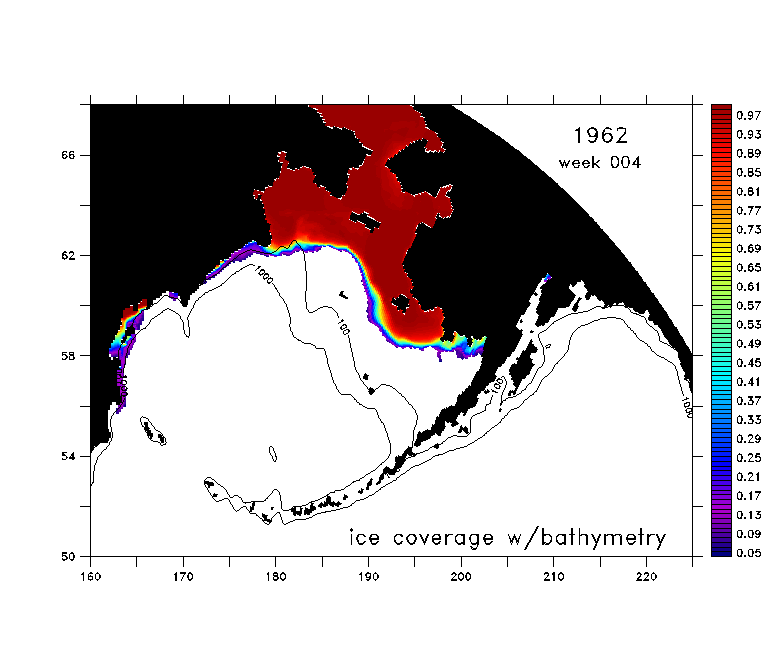
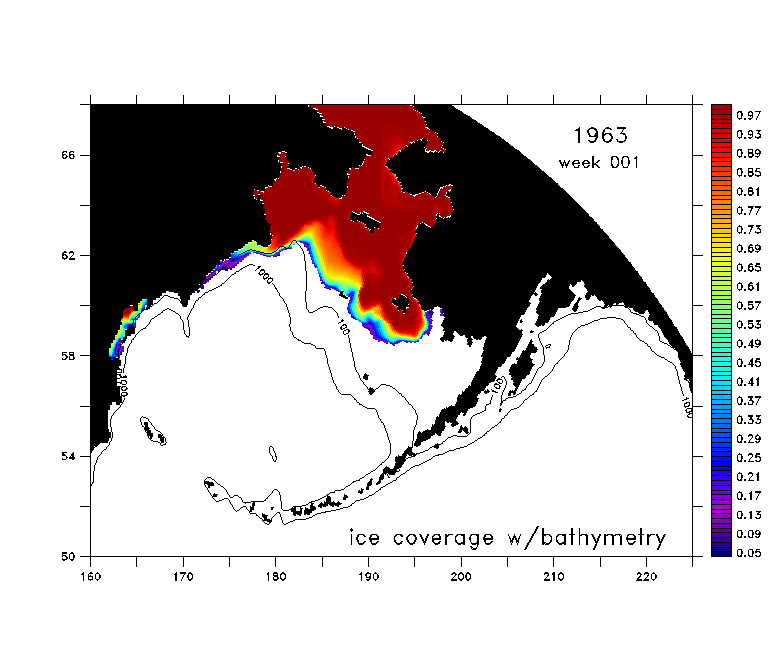
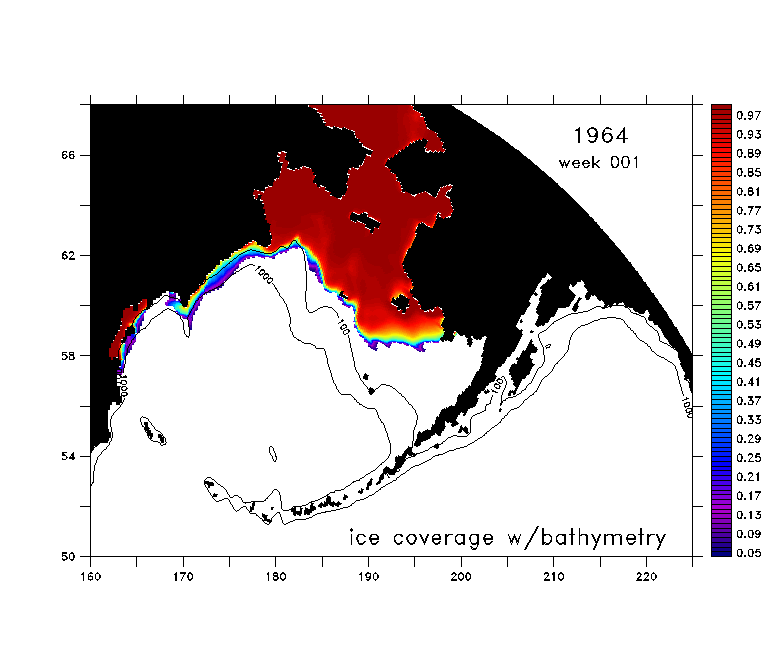
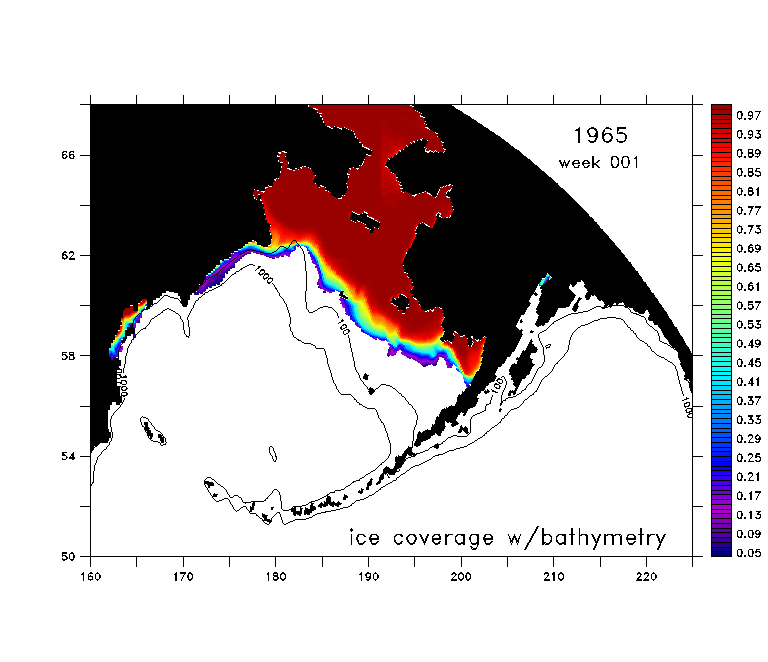
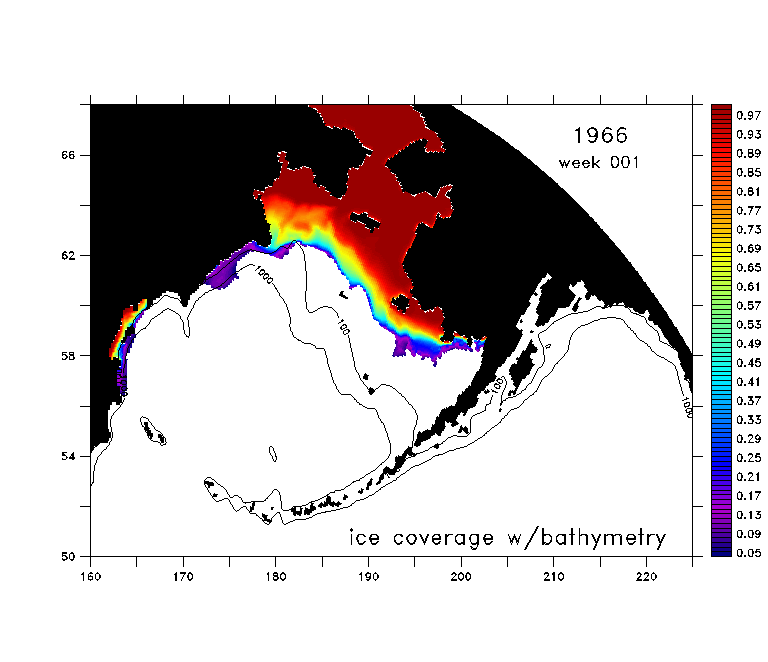
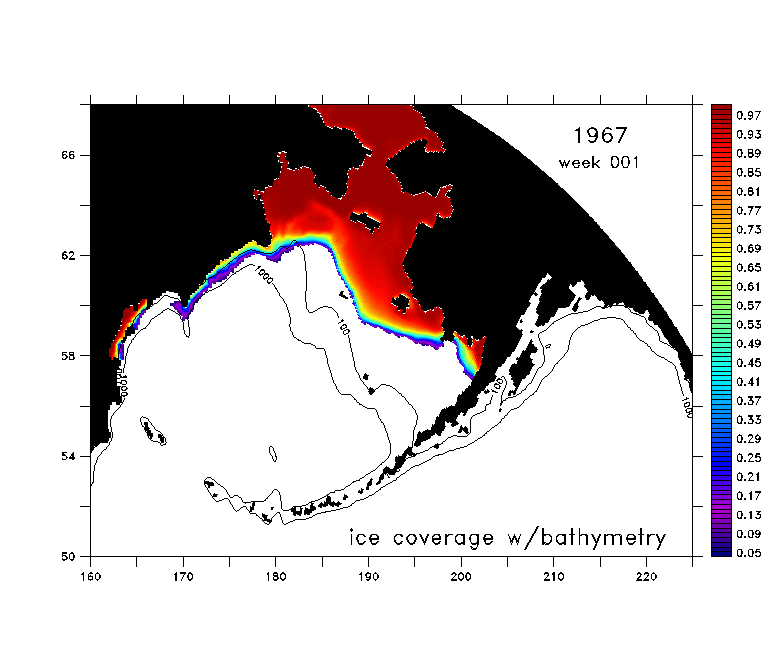
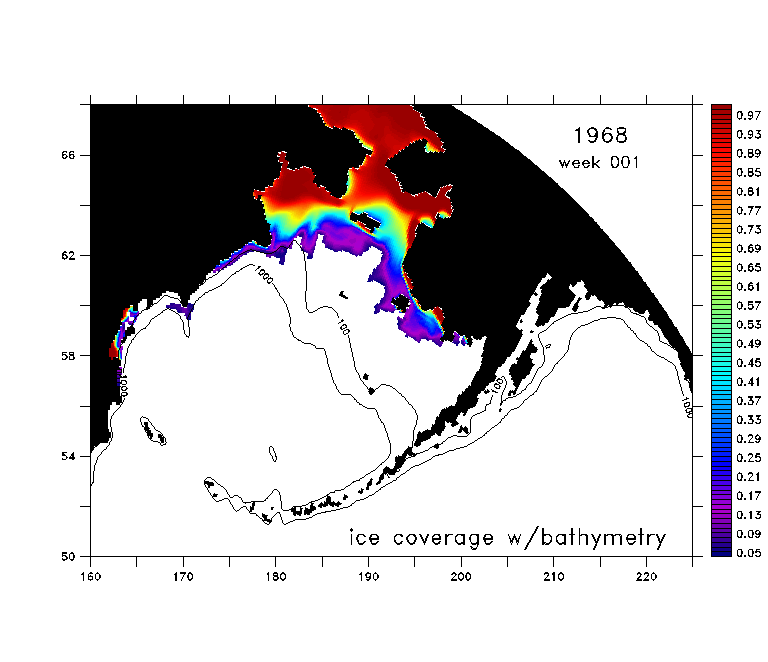
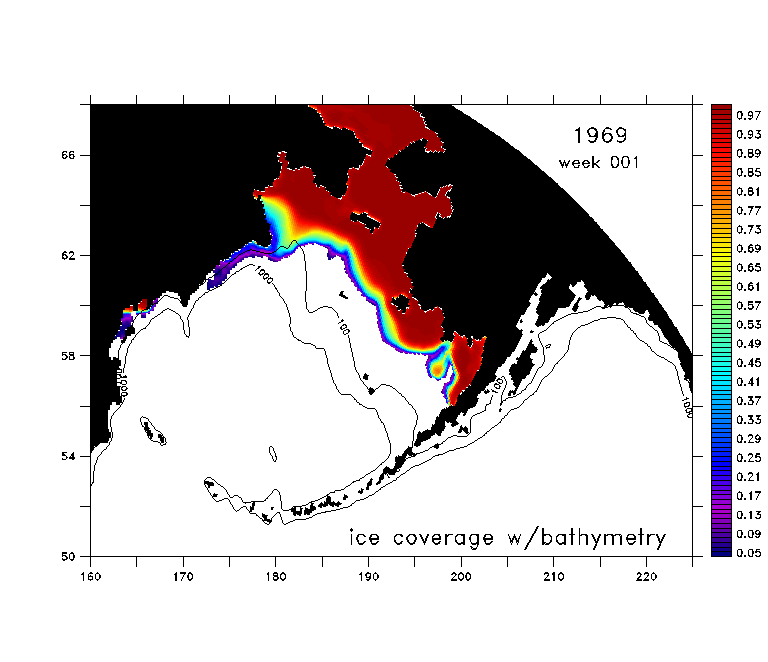
we have completed hindcasts for 1960-1970. Related simulations have been used
for Lagrangian tracking of fish larvae. A finer-scale (3-km) version of the
Bering Sea model will be developed in the coming year, contingent on the availability
of funds. This newer version will include tidal dynamics.
The modeling component of NPCREP presently employs a 10-km resolution model
which spans the entire Bering Sea, based on the Regional Ocean Modeling System
(ROMS, Haidvogel et al 2000, Schepetkin and McWilliams 2005). ROMS is a primitive
equation, free-surface model constructed with curvilinear-orthogonal horizontal
coordinates and stretched vertical coordinates (further details available at
the ROMS
website). The stretched vertical coordinate system (here, 30 levels) is utilized
for enhanced resolution of both surface and bottom boundary layers. The full
domain of the model includes the Northeast Pacific (NEP) from Baja California
through the Bering Strait, and extends from the coast to ~2000 km offshore.
This domain is nested within a larger one, spanning the entire North Pacific
at ~40-km resolution. This version of ROMS has been expanded to include ice
dynamics as implemented by P. Budgell (pers. comm.). Our hindcasts are driven
by NCEP winds and heat fluxes, with corrections to the NCEP shortwave flux based
on meteorological mooring data from the Bering Sea (Ladd and Bond, 2002). In
collaboration with E. Curchitser, we have developed model hindcasts for the
period 1996-2003 which do an excellent job of capturing the observed interannual
variability of ice cover in the Bering Sea (see Figs 1 and 2). More recently
we have completed hindcasts for 1960-1970. Related simulations have been used
for Lagrangian tracking of fish larvae. A finer-scale (3-km) version of the
Bering Sea model will be developed in the coming year, contingent on the availability
of funds. This newer version will include tidal dynamics.
| 1960 | |||
| 1964 | |||
| 1968 | (11MB) |
| Figure 1. Spatially nested ROMS domains for the North Pacific. Mean grid spacing is indicated for each domain; possible future grids and resolutions are also noted. | Figure 2. Hindcast (red) versus observed (blue) total ice cover in the Bering Sea for the period 1996-2004. The smooth blue line indicates the annual average observed ice cover. |
 |
 |
REFERENCES:
| EcoFOCI Project Office NOAA/PMEL and NOAA/AFSC |
|
| 7600 Sand Point Way NE Seattle, Washington 98115 Comments and information |
|