|
|
| Home | Log | the Research | Images and Video | Maps | Data | Links |

Bering Sea Ice Expedition 2008 Data* |
|||||||||||||||||||||||||||||||||||||||||
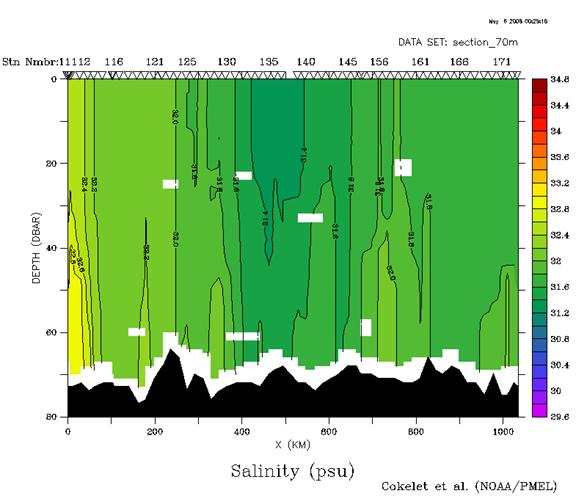
The Bering Sea Ice-Edge Expedition ended on May 6, 2008. The Spring was a cold one. Plots from some of the data we collected are shown below. These are preliminary plots, and something we quickly make so we can view our progress during the cruise. Data are being processed and analyzed further at our laboratories.
The maps below show along-track data. Water samples were taken from the underway seawater sampling system on the USCGC Healy and analyzed to obtain the plotted data: temperature, conductivity for salinity calculation, chlorophyll concentration, nitrate concentration and dissolved oxygen values.      A summary of sampling by the Hydrographic Group, March 29- May 6, 2008
Preliminary data, collected during our 2007 Bering Sea Ice-edge Expedition. Results from research activities during our 2006 Bering Sea Ice-edge Expedition: Along-track plots of
temperature, salinity and chlorophyll/fluorescence from the Thompson. Mooring Site 2 zooplankton counter 2006 Summary of seabird and cetacean observations from NOAAS Miller Freeman Other data links pertinent to our Bering Sea work: *All data shown here are the intellectual property
of the scientists who collected them. Data may not be used for publication without permission from
the collecting scientist. Permission can be obtained through the "Contact Information"
link at the bottom.
|
|||||||||||||||||||||||||||||||||||||||||
| Privacy | Disclaimer | Accessibility | Contact Information |